 pic found here: https://unsplash.com/photos/fPkvU7RDmCo
Have you moved to the cloud? Are you moving to the cloud? Are you wondering what is involved in visualizing Imperva RASP logs in the cloud? You have come to the right place. I have been working in the Microsoft Azure cloud environment for the past year, including Microsoft Application Insights. I have found Azure easy to understand and quick to configure, so I have been eager to explore setting up Sentinel, Azure’s SIEM, for visualizing Imperva RASP logs.
Imperva RASP blocks exploits against your web applications, microservices, and API’s. Imperva RASP protects the entire application runtime and any 3-party dependencies, so that you can ship code faster with less risk and so that you are not forced into emergency off-cycle patching of 0-days. Whether a vulnerability in your source code can be exploited by an injection, for example, or whether one of your 3rd-party libraries can be exploited by a 0-day attack, Imperva RASP provides automatic blocking protection against these exploit attempts.
A RASP customer who recently has moved from on-premise to Azure cloud has been visualizing their RASP data in Splunk, but asked me if it would be possible to do the same in Azure. I will show how I have leveraged Logstash to feed Imperva RASP logs into Azure Sentinel, so that I can visualize the logs in an Azure Sentinel Workspace dashboard.
The example dashboard below took me literally minutes to build. The dashboard includes two visualizations. The first is a pie chart that displays the total number of exploit attempts with a breakdown by attempted exploit type. The second is a table that provides details of these attempted exploits, broken down into each of the attempted exploit types and grouped into 5-minute intervals:
The Logstash pipeline that I had used to feed Azure Sentinel was as such:
sudo ./logstash -e 'input{file{codec => "json" path => ["/path/to/rasp/event/log"] sincedb_path => "/dev/null" start_position => "beginning"}} filter{mutate{rename => { "query" => "details" }} mutate{rename => { "network_activity_destination" => "details" }} mutate{rename => { "uri_query" => "details" }} mutate{rename => { "input" => "details" }}}output{microsoft-logstash-output-azure-loganalytics{workspace_id => "workspace_id" workspace_key => "workspace_key" custom_log_table_name => "NameOfCustomLogFile_CL" key_names => ['timestamp','category',’details’]}}'
Where I specified values for:
/path/to/rasp/event/log
workspace_id in Azure Sentinel
workspace_key for the workspace_id in Azure Sentinel
NameOfCustomLogFile_CL of the custom log, where name must end with _CL (mine was named RASP_Attack_Log_CL)
The Logstash pipeline includes a filter, and that filter mutates each of four fields into a details field. In my dashboard, I am only showing a subset of the high impact exploit attempts. Each RASP event message has common fields (for example, timestamp, OS, app name, etc.) and specific fields (for example, SQL injection has a “query” field). In my report, Logstash extracts the exploit payloads from the various attack events and mutates each into a single “details” field.
Formatting the filter for readability’s sake, the filter includes these mutations:
filter {
mutate{rename => { "query" => "details" }}
mutate{rename => { "network_activity_destination" => "details" }}
mutate{rename => { "uri_query" => "details" }}
mutate{rename => { "input" => "details" }}
}
- For SQL injection, the value of the query attribute is the payload that contained the SQL injection.
- For unauthorized network activity, the value of the network_activity_destination attribute is the server that the application was trying to reach.
- For command injection, the value of the uri_query attribute is the command that contained the injections.
- For cross-site scripting, the value of the input attribute is the attacking script.
What I find nice about being able to set up these mutations is that I am able to get the most important information, regardless of the type of attack, into a single column in my custom log in Azure Sentinel.
Additionally, I have found Logstash to be powerful, flexible, scalable, and intuitive. In fact, I had no prior exposure to Logstash before having undertaken this visualization effort.
The custom log that Logstash creates is found at Azure Sentinel/Logs/Custom Logs. I found it nice and simple that the custom log gets created without me needing to define a schema for the log – very easy and very practical.
Once I saw that the records were appearing in the custom log, I built my dashboard in Azure Sentinel/Workbooks/Add Workbook.
The Kusto Query Language (KQL) is used to define queries for Azure Sentinel Workbooks. For those who have working knowledge of SQL for databases, KQL is similar to SQL.
The KQL query that had built the pie chart is:
RASP_Attack_Log_CL
| where Category != "Statistics" and Category != "Dependency" and Category != "Configuration" and todatetime(timestamp_s) > ago(60d)
| summarize Count=count() by Category
Where RASP_Attack_Log_CL is the name of my custom table, and where Display label for each category was set in Chart Settings.
The Kusto Query Language (KQL) query that had built the grid is:
RASP_Attack_Log_CL
| where Category != "Statistics" and Category != "Dependency" and Category != "Configuration" and todatetime(timestamp_s) > ago(60d)
| summarize Count=count() by bin(todatetime(timestamp_s), 5m), details_s, Category
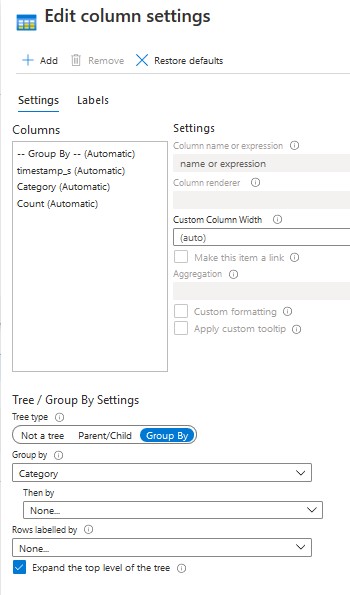
Where RASP_Attack_LogCL is the name of my custom table, and where Group By was set to Category in Column Settings.